A PAR sheet slotss — Probability Accounting Report — is the complete mathematical blueprint of a slot machine: every symbol, every reel, every stop position, every combination probability, and every RTP calculation, documented in a single proprietary file that players never see but that determines everything about how a slot actually behaves. Understanding what a PAR sheet contains, how it is constructed, and why its contents are kept confidential changes how you interpret every number published about a slot game.
What a PAR Sheet in Slots Actually Is
PAR stands for Probability Accounting Report. It originated in mechanical reel slot machines as the document that specified how each physical reel was weighted — how many stops it had, which symbols occupied which positions, and what the resulting win probabilities were. In the online slot era, the PAR sheet has evolved into a comprehensive mathematical specification document that covers the entire game, but the core purpose is unchanged: it is the authoritative record of how the slot’s probability architecture is constructed.
PAR Sheet in Slots — Key Facts
The PAR sheet is created during the math design phase of slot production — before any game code is written, before art direction is finalised, and before features are engineered. It is the specification that everything else is built against. If the live game’s math does not match the PAR sheet, the game fails certification.
Why “Probability Accounting”?
The name reflects the document’s purpose precisely. Every probability in the game is accounted for — meaning specified, calculated, and verified. The PAR sheet does not describe what might happen; it specifies the exact probability of every possible outcome, and those probabilities must sum correctly to produce the stated RTP. It is a probability ledger, not a game design document. Art, audio, and feature experience are layered on top of it — the PAR sheet is the mathematical foundation beneath all of that.
The 7 Core Sections of a Slot PAR Sheet
While PAR sheet formats vary between studios and jurisdictions, all substantive PAR sheets cover the same seven areas of information. Understanding what each section contains is what allows you to read published slot data intelligently.
1. Game Overview and Specifications
Game title, version number, reel configuration (e.g. 5×3, 6×4), number of paylines or ways, coin denomination range, minimum and maximum bet, and the target RTP. This section establishes the game’s commercial parameters and the mathematical targets the rest of the document must deliver.
2. Symbol Set and Paytable
Every symbol in the game listed with its payout values for each winning quantity (e.g. 3-of-a-kind, 4-of-a-kind, 5-of-a-kind on a payline). Wild substitution rules, scatter pay rules, and any special symbol behaviour (stacked, expanding, sticky) are specified here. The paytable section is the player-visible output of the PAR sheet — but without the reel strips, the paytable values are uninterpretable.
3. Reel Strips
The complete stop-by-stop specification of every reel — which symbol occupies each stop position, in order. This is the most sensitive section of the PAR sheet. It is not published to players in any jurisdiction. The reel strips, combined with the paytable, determine every probability in the game.
4. Win Combination Table
Every possible winning combination listed with its probability of occurrence and its payout value. The product of probability × payout for every combination sums to the game’s total RTP. This section is the mathematical proof that the reel strips and paytable produce the stated return. Testing labs verify this calculation independently.
5. Feature Math Specifications
For each bonus feature — free spins, hold-and-spin, pick games, cascades — the trigger probability, average feature value, and RTP contribution are documented. This section proves that the bonus features deliver their stated contribution to total RTP and that they trigger at the specified average frequency.
6. RTP Breakdown and Volatility Data
Total RTP, split between base game and bonus contributions. Hit rate (proportion of spins returning anything). True win rate (proportion of spins returning more than the stake). Maximum win. Volatility index (typically expressed as a number or Low/Medium/High classification). Standard deviation of session outcomes. This section is the summary layer above the full probability calculations.
7. Simulation Results
Results from the studio’s internal simulation run — typically 1 billion or more spins — confirming that the implemented math model produces RTP, hit rate, and bonus frequency within the specified tolerances. The testing lab runs its own independent simulation to verify these results against the live game build.
Reel Strips and Symbol Weighting: The Beating Heart of the PAR Sheet
The reel strip is the most fundamental data structure in the PAR sheet, and understanding it explains why slot outcomes are what they are — including why the high-value symbol almost never lands, why certain combinations feel impossible to complete, and how max wins of 50,000× are mathematically achievable but statistically rare.
What a Reel Strip Is
A reel strip is a sequential list of every stop position on a virtual reel, with a symbol assigned to each position. A reel with 64 stops has 64 entries in its strip. The RNG generates a number that maps to one of those 64 stop positions — the symbol at that position is what appears in the reel window for that spin. Across 5 reels, 5 independent RNG samples each select one stop from their respective reel strips, producing the final displayed combination.
Symbol Weighting in Practice
Symbol weighting is how often a given symbol appears across the reel strip. A symbol that appears at 2 of 64 stop positions has a weight of 2/64 = 3.1%. A symbol at 12 of 64 stop positions has a weight of 12/64 = 18.75%. The math designer adjusts these weights to hit the target RTP and volatility.
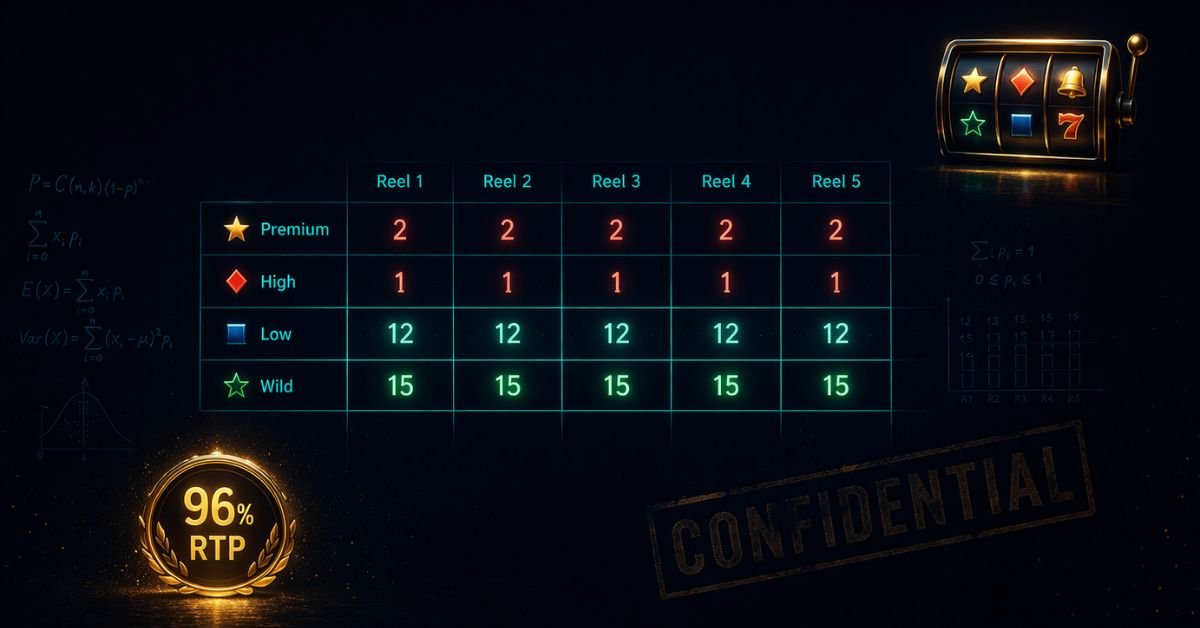
Here is a simplified illustrative example of how a single reel strip might be structured for a 5-reel slot with a 64-stop reel. This is illustrative — actual reel strips are never published.
Illustrative Reel Strip — 64 Stops per Reel (Simplified Example)
| Symbol | Reel 1 Stops | Reel 2 Stops | Reel 3 Stops | Reel 4 Stops | Reel 5 Stops | Weight (R1) |
|---|---|---|---|---|---|---|
| ★ Premium Symbol | 2 | 2 | 1 | 2 | 1 | 3.1% |
| ♦ High Symbol A | 3 | 3 | 2 | 3 | 2 | 4.7% |
| ♣ High Symbol B | 4 | 4 | 3 | 4 | 3 | 6.3% |
| ◆ Mid Symbol A | 6 | 6 | 5 | 6 | 5 | 9.4% |
| ● Mid Symbol B | 7 | 7 | 6 | 7 | 6 | 10.9% |
| ▲ Low Symbol A | 10 | 10 | 9 | 10 | 9 | 15.6% |
| ■ Low Symbol B | 12 | 12 | 11 | 12 | 11 | 18.8% |
| ☆ Wild Symbol | 3 | 3 | 2 | 3 | 2 | 4.7% |
| ◎ Scatter Symbol | 2 | 2 | 2 | 2 | 2 | 3.1% |
| — Blank | 15 | 15 | 23 | 15 | 23 | 23.4% |
| TOTAL | 64 | 64 | 64 | 64 | 64 | 100% |
Illustrative example only — not from any published PAR sheet. Real reel strips are proprietary. Note how blanks dominate Reels 3 and 5, suppressing win frequency on the critical middle and final reels. The premium symbol appears at only 3.1% weight — meaning it lands roughly once in every 32 stops, making 5-of-a-kind extremely rare even before considering all 5 reels must align.
Why the Premium Symbol Is So Rare
In the illustrative strip above, the premium symbol appears at 2 of 64 stops on Reel 1 (3.1%) and 1 of 64 stops on Reels 3 and 5 (1.6%). For a 5-of-a-kind combination to land, the RNG must select a premium stop position on all 5 reels simultaneously:
= 0.031 × 0.031 × 0.016 × 0.031 × 0.016
≈ 1 in 40,000,000 spins
How Reel 3 and Reel 5 Suppression Works
Notice in the illustrative strip that Reels 3 and 5 carry far more blank stops (23 each vs 15 on Reels 1, 2, and 4). This is intentional symbol weighting asymmetry. By suppressing high-value symbol appearances on the middle and final reels, the math designer reduces the frequency of 5-of-a-kind completions dramatically — the first two reels may tease the player with premium symbols, but the third reel kills the combination most of the time. This is also how near-misses are structured: high-value symbols land on early reels more often than they complete across all five.
Near-misses are reel strip design, not random chance. When two high-value symbols land on the first two reels and the third does not complete, this is the direct result of intentional weight differences between early and late reels in the PAR sheet. Near-misses are more frequent than pure probability would produce because the strip is designed that way. They are not signals that the combination is close — they are a consequence of asymmetric symbol weighting across the reel set.
How the PAR Sheet Calculates RTP
The RTP calculation in a PAR sheet is a complete enumeration of every possible outcome: for each winning combination, multiply its probability by its payout value, then sum all combinations. The result is the theoretical RTP.
for every winning combination in the game
A Worked Contribution Example
Using the illustrative reel strip above, suppose 3× Low Symbol B pays 5× the line bet. The probability of 3× Low Symbol B landing on a specific payline depends on the symbol’s weight on each of the first three reels:
| Reel 1 | Reel 2 | Reel 3 | Probability | Payout | RTP Contribution |
|---|---|---|---|---|---|
| 12/64 = 18.75% | 12/64 = 18.75% | 11/64 = 17.19% | ~0.605% | 5× line bet | ~3.02% of RTP |
This single combination contributes approximately 3.02% toward total RTP. Add up the contributions from every other combination — hundreds of them, across all symbols, all quantities, all paylines, plus bonus features — and the sum must equal the target. A 96% RTP game has a probability-weighted contribution table that sums to exactly 0.9600 (96.00%).
Why This Makes Every Paytable Value a Precision Decision
Changing a single paytable value — for example, increasing the 3× Mid Symbol A payout from 8× to 10× — increases that combination’s RTP contribution and takes the total above target. To compensate, the math designer must either reduce another payout value, reduce a symbol’s weight on one or more reels, or both. Every paytable change cascades through the entire RTP calculation. This is why professional math designers work in simulation tools rather than spreadsheets — the interdependencies are too complex to manage manually at scale.
How Paytables Are Built: Why Small Symbol Changes Cascade Into a Different Game
The paytable is the player-visible face of the PAR sheet — the grid showing what each symbol pays at each quantity. What players rarely appreciate is how sensitive the paytable is to small adjustments, and why the numbers in it cannot be changed arbitrarily.
The Paytable as a Budget Allocation
The math designer has a total RTP budget — say 96%. The paytable is essentially how that 96% is allocated across different win types. How much goes to frequent small wins on low symbols? How much to rare premium symbol completions? How much to the bonus feature? These are design decisions that determine the game’s feel, not just its math.
| Win Type | Frequency | Payout Range | Typical RTP Allocation | Design Effect |
|---|---|---|---|---|
| Low symbol 3-of-a-kind | High — multiple per session | 3×–8× line bet | ~15–25% of total RTP | Creates session activity and LDWs on multi-line games |
| Mid symbol 3–4-of-a-kind | Moderate | 8×–40× line bet | ~20–30% of total RTP | The “bread and butter” wins — keeps balance visible |
| High symbol 4–5-of-a-kind | Low — infrequent | 50×–500× line bet | ~15–25% of total RTP | The memorable base-game wins — creates session peaks |
| Bonus feature (free spins, etc.) | Rare — 1 in 100–200 spins typically | Variable — wide distribution | ~30–60% of total RTP | The primary driver of volatility and max win potential |
| Premium 5-of-a-kind | Very rare | 500×–5,000×+ line bet | ~2–8% of total RTP | Provides the headline maximum win — rarely hit, but real |
The Cascade Effect of Changing One Value
Suppose the math designer increases the 5× Premium payout from 2,000× to 3,000× the line bet. The RTP contribution of that combination increases by 50%. If it was previously contributing 4% toward total RTP, it now contributes 6%. To keep total RTP at 96%, 2% must come out somewhere else — typically by reducing mid-tier symbol payouts or by reducing a symbol’s weight on one or more reels. Either change alters the game’s hit rate, its session rhythm, and its volatility profile. A single paytable value change cannot be made in isolation: it propagates through the entire math model.
This is why “just bump the payouts” is not how game design works. Every value in a slot paytable is constrained by the RTP budget and the reel strip weights. Studios cannot simply increase payouts to make a game more generous without either reducing RTP (taking from other combinations) or reducing the frequency of that symbol landing (adjusting reel strips). Player-facing generosity is a zero-sum math allocation problem.
How the PAR Sheet Encodes Volatility
Volatility is not a single number pulled from a formula — it emerges from the shape of the win distribution encoded in the PAR sheet. Two games with identical 96% RTP can have completely different volatility because their win distributions are structured differently.
Win Distribution Shape
A low-volatility game has a wide, flat win distribution: many different win sizes across a relatively small range, all occurring with moderate frequency. The RTP is delivered through many small-to-medium wins. A high-volatility game has a narrow, tall win distribution: most spins return nothing, but a small proportion return very large amounts. The RTP is concentrated in rare, large events.
Low Volatility PAR Sheet Signature
High weight on low-to-mid symbols across all reels. Smaller paytable range — top payout typically 200×–1,000× stake. Low bonus RTP allocation (30–40% of total). High hit rate (30%+). Many combinations contributing small amounts to RTP. Result: frequent activity, slow balance drain, rare large events.
High Volatility PAR Sheet Signature
Very low weight on premium symbols — suppressed on mid and late reels. Wide paytable range — top payout 5,000×–50,000×+ stake. High bonus RTP allocation (60–80% of total). Low hit rate (15–25%). Few combinations contributing very large amounts to RTP. Result: long dry spells, rare but very large wins, high variance session outcomes.
The volatility index published on slot info pages (typically Low/Medium/High or a numeric score) is the math designer’s summary of the win distribution shape. It is derived from statistical measures — standard deviation and variance of session outcomes — calculated from the PAR sheet’s complete probability table. It is not an arbitrary label; it is a mathematical property of the reel strips and paytable combined. See the full volatility guide for how this translates to session behaviour.
Who Sees PAR Sheets — and Why Players Don’t
PAR sheets flow through a specific chain of custody that keeps their content out of public reach while ensuring regulatory oversight.
| Party | Access to PAR Sheet? | Reason |
|---|---|---|
| Game studio / math team | Full access | They create and own it — it is their core IP |
| Independent testing lab | Full access, under NDA | Required to verify game math against the specification |
| Licensing authority (MGA, UKGC, etc.) | Full access, confidential | Required for regulatory oversight — not disclosed publicly |
| Casino operators | Partial — RTP, hit rate, feature specs only | Operators need commercial parameters; studios protect reel strip IP |
| Players | None — in virtually all jurisdictions | Treated as proprietary trade secrets; partial disclosure in select jurisdictions only |
| Game review sites / media | None — published RTP only | Studios do not release PAR sheets for commercial or IP protection reasons |
Why Studios Protect Reel Strips So Carefully
Reel strips are the most commercially sensitive element of a slot’s IP. If a competitor has access to your reel strips and paytable, they can reverse-engineer your math model and replicate the game experience — the hit rate, the win distribution, the volatility profile — without copying art or code. Studios have spent years and significant resources developing math models that produce specific commercially attractive experiences. Reel strip data is treated with the same confidentiality as pharmaceutical formulas or algorithmic trading logic.
Where PAR Sheets Are Partially Public
Some Canadian provincial lottery corporations (Ontario Lottery and Gaming, British Columbia Lottery Corporation) have historically published PAR sheets for their land-based terminal slots — a practice that has given researchers access to real reel strip data. These published documents are the primary source for academic work on slot math. Some US state gaming control boards make PAR sheets available under freedom of information requests. Online slot PAR sheets from international studios are not accessible through these channels.
PAR Sheets and RTP Variants: The Same Game, Different Math
When a studio offers multiple RTP variants of the same slot — a common commercial practice — each variant has its own distinct PAR sheet. A game offered at 94%, 96%, and 97% is mathematically three different games that share the same art, audio, and feature structure.
How Variants Differ in the PAR Sheet
The math designer adjusts the variant PAR sheets by modifying either symbol weights (adjusting how often symbols appear on each reel) or paytable values (changing what combinations pay), or both. The changes are typically modest — a few stops moved on key symbols, or mid-tier symbol payouts adjusted by a few multiplier points — but they cascade through the entire probability calculation to shift RTP by 2–3 percentage points. The feature structure, max win cap, and bonus trigger frequency may remain largely unchanged between variants; it is the base game math that absorbs most of the RTP difference.
What Changes Between RTP Variants
This is why playing the same slot at different casinos can produce different long-run returns — the games look and play identically but have different PAR sheets underneath. It is also why checking which RTP variant a casino offers (where this information is disclosed) is a meaningful pre-play decision, not a minor detail.
What Players Can Use Instead of a PAR Sheet
Since PAR sheets are not player-accessible, the practical question is what information is available and how to use it effectively.
Published RTP
The game info screen or help file should state the certified RTP. In most licensed markets, this is a regulatory requirement. The number is meaningful — it is the certified long-run return from the game’s PAR sheet. The caveat: it may represent the highest available variant, not the one configured at your specific casino. The RTP guide covers how to interpret and use this number correctly.
Volatility Rating
Studios and game review databases publish volatility ratings — typically Low/Medium/High or a numeric scale. This is the math designer’s summary of the win distribution shape from the PAR sheet. Combined with RTP, it is the most useful player-accessible proxy for the full PAR sheet experience. See volatility explained for the full framework.
Hit Rate and Feature Frequency
Some studios (NoLimit City being a notable example) publish hit rate and bonus trigger frequency data alongside their games. Where available, these numbers directly reflect the PAR sheet’s probability calculations — how often any spin returns something, and how often the bonus feature triggers on average. The hit rate guide explains how to use these numbers in practice.
Max Win
The published max win is specified in the PAR sheet and certified by the testing lab. It is a hard cap — the game cannot pay more than this amount regardless of symbol combinations or feature outcomes. Knowing the max win helps calibrate the game’s theoretical upside relative to its cost. The max win guide covers the full commercial and mathematical significance.
The most useful frame: Think of the published RTP, volatility rating, hit rate (where available), and max win as the four player-accessible outputs from the PAR sheet. Together they give you an accurate enough picture of the game’s math model to make informed choices about which games suit your bankroll and session preferences — without needing the reel strip data that sits beneath them.
Further Reading
The PAR sheet in slots is the foundation document beneath every piece of published slot data. How Slot Machines Are Made places the PAR sheet in the full 8-stage production pipeline — stage 2, math design, is where the PAR sheet originates. Slot Game Math Models Explained covers the RNG, hit rate, and volatility framework that the PAR sheet encodes, from a player-facing perspective. How RNG Works in Online Slots goes deep on the PRNG implementation and reel mapping that translates PAR sheet stop positions into actual spin outcomes. Slot Hit Rate explains the specific hit rate statistic that comes directly from the PAR sheet’s win combination table — the distinction between hit rate, true win rate, and LDW rate is a PAR sheet output. RTP Guide covers how to interpret the RTP number that the PAR sheet calculates and the testing lab certifies. Slot Volatility explains how the win distribution shape encoded in the PAR sheet produces the Low/Medium/High ratings players see. Near-Miss Effect in Slots connects to reel strip asymmetry — the reason near-misses are more frequent than pure probability would produce is written directly into the PAR sheet’s symbol weighting across reels. Losses Disguised as Wins relates to PAR sheet construction on multi-line games — the low-value symbol weights that produce frequent sub-stake returns are PAR sheet design decisions. For the interactive math experience, the Relic Charge Slot Math Prototype demonstrates a simplified PAR sheet implementation in playable form — reel mapping and paytable calculation made visible.
See How RTP and Volatility Interact in Your Session
The Slot Volatility and RTP Calculator models what the PAR sheet math produces across a real session — expected loss range, variance boundaries, and the probability of hitting your loss limit before your spin count.
Open the RTP Calculator →PAR Sheet in Slots — FAQ
What does PAR stand for in slot machines?
PAR stands for Probability Accounting Report. It is the complete mathematical specification document for a slot machine, covering every symbol, reel strip, stop position, winning combination, RTP calculation, and feature specification. It originated in mechanical reel slot design and continues as the standard mathematical documentation format for online slot games.
Can players access a slot’s PAR sheet?
Not in any standard commercial jurisdiction for online slots. PAR sheets are proprietary documents treated as trade secrets by game studios. They are submitted to regulatory testing labs and licensing authorities under confidentiality. Some Canadian provincial lottery corporations have historically published PAR sheets for their land-based terminals, and some US state gaming control boards release them under freedom of information requests — but online slot PAR sheets from international studios are not publicly accessible.
What is a reel strip in a slot machine?
A reel strip is the complete sequential list of symbol positions on a virtual reel — each stop position in the sequence has a symbol assigned to it. The RNG samples a stop position from this list for each reel on every spin. The number of times a symbol appears across the reel strip determines how frequently it lands. High-value symbols typically occupy very few stop positions; low-value symbols and blanks occupy many more.
Why are high-value symbols so rare in slots?
Because they are assigned very few stop positions on the virtual reel strips in the PAR sheet. A premium symbol might appear at only 2 of 64 stops on a reel — a weight of 3.1%. For a 5-of-a-kind combination to land, that weight must align across all 5 reels simultaneously. The probability can easily be 1 in several million spins. The rarity is not random variance — it is a mathematically specified property of the reel strip design.
How does the PAR sheet calculate RTP?
RTP is calculated by enumerating every possible winning combination, calculating its probability from the reel strip weights, multiplying that probability by the combination’s payout value, and summing all results. The total must equal the target RTP within the approved tolerance. This is verified by the testing lab through independent simulation of hundreds of millions of spins on the actual compiled game code.
Why do small paytable changes affect the whole game?
Because every paytable value contributes a specific, calculated amount to total RTP. Changing one payout value changes that combination’s RTP contribution and takes the total above or below target. To compensate, other values must be adjusted — either other paytable entries or the symbol weights on the reel strips. These compensatory changes alter hit rate, win frequency, and the game’s feel at the session level. No paytable value exists in isolation.
Do different RTP variants of the same slot have different PAR sheets?
Yes. Each RTP variant is a distinct certified math model with its own PAR sheet. The reel strips and/or paytable values are adjusted between variants to shift the total RTP. The game’s art, audio, and feature structure are typically identical across variants; it is the underlying probability architecture that differs. A 96% variant and a 94% variant of the same game are mathematically different certified builds.
Why are near-misses more common than random chance would predict?
Because reel strip weighting is asymmetric across the reels — high-value symbols are given higher weight on early reels and lower weight on middle and late reels. This means the first two reels frequently show premium symbols while the third or fourth reel does not complete the combination. Near-misses are a consequence of deliberate PAR sheet design, not purely random distribution. They are more frequent than a purely random system would produce because the reel strip makes them so.