Your slot shows a win. The balance moves. Then you look at the total staked and realise you are down. Hit frequency win rate RTP are three different numbers that measure three completely different things about how a slot behaves — and most players, and most gambling sites, treat them as if they are roughly the same thing. They are not. The gaps between them explain why a game with a 35% hit rate can feel like it rarely pays, why a 96% RTP game will drain your balance faster than you expect, and why the number your casino displays most prominently is the one that tells you the least about what will actually happen during your session. This article gives you the precise definition of each, the exact formula, and the practical difference that matters before you open a game.
Why the Three Numbers Exist — and Why They Diverge
Hit frequency, win rate, and RTP each answer a different question about a slot game. Hit frequency answers: “How often will something come back?” Win rate answers: “How often will I actually profit on a spin?” RTP answers: “What is the average total return per unit wagered across an infinite number of plays?” These are three separate mathematical questions with three separate answers. In many contexts they will have very different numerical values. The confusion between them is not a minor terminology issue — it produces genuine misunderstanding about how a session will feel, what the actual cost of play is per spin, and what “winning” at a slot actually means.
The divergence between the three is most severe on modern multi-line video slots, where a mechanism called Losses Disguised as Wins (LDW) creates a systematic wedge between hit frequency and win rate. On a 20-payline game, a spin can trigger a return on three paylines while costing more in total stake than the combined returns produce — the game shows a “win” animation and credit addition while the player’s balance has actually decreased. This spin counts toward hit frequency. It does not count toward win rate (because the net result is a loss). RTP absorbs both outcomes as part of its aggregate calculation. On games with significant LDW exposure — which includes the majority of modern multi-line slots — hit frequency can run 10–20 percentage points higher than win rate. A player who assumes hit frequency and win rate are the same thing is systematically overestimating how often they are profiting per spin.
Hit Frequency Win Rate RTP — Quick Reference
Hit Frequency: The Frequency of Any Return
Hit frequency is the proportion of total spins that return any positive amount — the raw frequency of a non-zero payout on a given spin. It does not matter whether the return is greater than, equal to, or less than the stake. A spin that costs £1 and returns £0.10 counts as a “hit.” A spin that costs £1 and returns £5 counts as a “hit.” Both are included in the hit frequency calculation. What matters is only whether the return is greater than zero.
Where “winning combination” means any combination of symbols across active paylines that produces a payout greater than zero, regardless of whether that payout covers the total stake. Expressed as a percentage of total spins.
Hit frequency is determined by the game’s functional model — specifically the reel strip configuration and payline structure. A reel set with dense low-value symbol coverage will produce high hit frequency because many low-combination arrangements return small amounts. A reel set with sparse coverage across all tiers — high blank density, few symbol combinations completing — will produce low hit frequency. The slot hit rate guide covers how hit frequency maps to session feel in practical terms.
What Hit Frequency Does and Doesn’t Tell You
Hit frequency tells you how often the game produces any kind of return. It says nothing about the size of those returns relative to the stake. This is the critical limitation: a game with a 40% hit frequency could be returning £0.05 on a £1 spin in most of those “hits.” The frequency of any return is high; the quality of those returns may be systematically below stake. This is not an edge case — it is the structural design of low-volatility multi-line games, where the high hit frequency is achieved by making many paylines pay very small amounts that collectively fail to cover the total multi-line stake.
Hit Frequency on Multi-Line Games: The Denominator Problem
On a 20-payline game where you stake £0.10 per line (£2 total), the game calculates a “hit” when any of the 20 paylines produces a winning combination. With 20 independent chances per spin, hitting at least one payline is substantially more probable than hitting on a single-line game. But the total stake has also multiplied by 20. A return of £0.30 — three paylines each paying £0.10 — counts as a hit with three winning lines. Your total stake was £2. You received £0.30. Net position: −£1.70. Hit frequency counts this spin as a “win.” Your balance does not.
Win Rate: The Frequency of Actual Profit Spins
Win rate is the proportion of total spins where the payout exceeds the total stake — the frequency of genuinely profitable individual spins. A spin that returns £1.01 on a £1 stake counts. A spin that returns £0.99 does not. The threshold is the total stake, not zero. This makes win rate the most accurate measure of “how often I actually gained money on a spin” — which is typically what players mean when they say they want to know how often they win.
Where “above-stake combination” means any spin outcome where total payout across all active paylines exceeds total stake for that spin. Win rate is always ≤ hit frequency. On single-line games the difference is small; on multi-line games it can be substantial due to LDW spins.
Win rate is almost never directly disclosed by game studios or casinos. It can be calculated from the full PAR sheet — which lists all winning combinations and their probabilities — but PAR sheets are not public. In the absence of published win rate data, players can estimate it from extended session observation or infer bounds from the published hit frequency and volatility. On single-payline games or games with very low payline counts, win rate ≈ hit frequency. On 20–40 payline games with active LDW design, win rate is typically 8–15 percentage points lower than hit frequency.
The LDW Wedge: Why Hit Frequency and Win Rate Diverge Most on Modern Slots
The mechanism that separates hit frequency from win rate most severely is Losses Disguised as Wins (LDW) — spins where one or more paylines produce a payout while the total of all payouts falls below the total stake. The game registers a win event (sounds, animations, credit counter movement) while the player’s net balance has decreased. These spins contribute to hit frequency. They do not contribute to win rate.
LDW frequency is directly related to the number of active paylines and the distribution of low-value payline pays in the game’s paytable. A game designed with many small payouts across many paylines will generate frequent LDW events — each one adding to hit frequency without benefiting win rate. Research into LDW prevalence has found it is a significant feature of modern multi-line slot design, representing a meaningful proportion of the hits that high hit-frequency games produce. A player who experiences “wins” frequently but sees their balance decline steadily is experiencing a high LDW rate — their hit frequency is high, their win rate is low.
RTP: The Aggregate Expected Return
Return to Player is a different type of measure entirely. It is not a frequency — it is an expected value. RTP does not answer “how often” any event occurs. It answers “what fraction of all money wagered is returned in payouts across a very large number of spins.” RTP is the probability-weighted average return across every possible spin outcome, including both winning and losing spins, weighted by how often each outcome occurs.
Summed across every possible winning combination in the game. The result is expressed as a percentage of stake. A 96% RTP means 96p is returned per £1 wagered in probability-weighted expectation across an infinite series of spins. It is not the return per session or per any finite number of spins.
The full RTP guide covers the correct interpretation in detail. The critical point for this article is what RTP does not tell you: it does not tell you how frequently you will receive any return (hit frequency), it does not tell you how frequently returns exceed your stake (win rate), and it does not tell you what your individual session will return. RTP is an aggregate statistical property of the game. Session outcomes are random variables that can deviate substantially from it in both directions — particularly on high-volatility games where the RTP is concentrated in rare events.
Why RTP Is the Most Published But Least Useful Number for Session Feel
RTP’s status as the primary disclosed game statistic in most jurisdictions reflects regulatory convention more than player utility. The number is easy to calculate, easy to certify, and easy to compare across games. But it is the least informative of the three numbers for understanding what a specific session will feel like. Two games with identical 96% RTP can have radically different hit frequencies (15% vs 38%), different win rates (8% vs 25%), and completely different session textures. RTP aggregates all of that into a single average that obscures all the variation underneath it.
Worked Example: Same Game, All Three Numbers
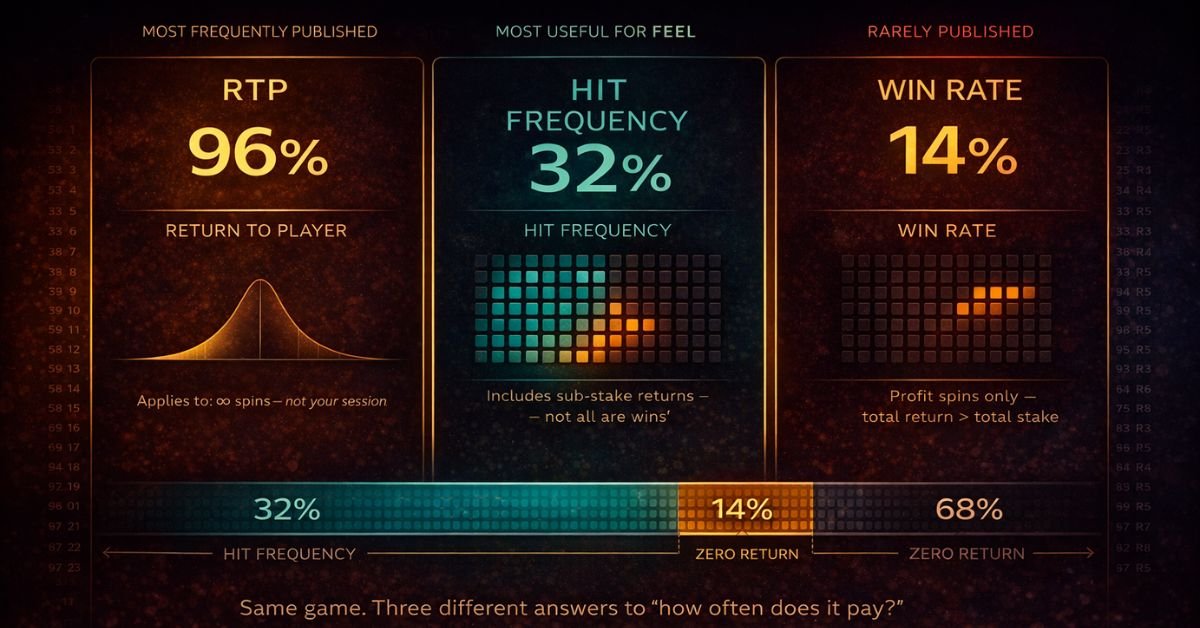
The most useful way to see the difference between hit frequency, win rate, and RTP is to look at the same game through all three lenses simultaneously. The following example uses illustrative but realistic numbers for a 20-payline medium-high volatility slot.
Illustrative numbers for a 20-payline medium-high volatility slot at 96% RTP. Not based on any specific published game.
What This Example Reveals
A player looking only at the 96% RTP figure knows the game is comparatively high-return for the online slot category. They might conclude they have a “good” chance of returning close to their stake. What they are missing is that only 14% of their spins will actually produce a profit — the other 86% will either return zero or a sub-stake amount. Their balance will decline steadily in 86% of spins, occasionally interrupted by profitable spins that slow the depletion. The session experience is not 96% of their money coming back — it is a persistent negative drift punctuated by occasional recoveries.
Now consider that the same game has a maximum win of 5,000×. Much of the RTP may be allocated to rare events — a single 5,000× hit at a probability of 1 in 500,000 contributes 5,000 ÷ 500,000 = 1% to RTP. In a 300-spin session, the probability of seeing that event is approximately 0.06%. Most players will never see it, yet it contributes to the published RTP as if it were part of every player’s realistic expectation.
What Each Number Actually Tells You
| Number | What It Answers | What It Doesn’t Tell You | Useful For |
|---|---|---|---|
| Hit Frequency | How often does any return occur per spin, including sub-stake amounts | Whether those returns are profitable. How much the average hit pays. Whether the session feel will be positive or negative. | Gauging session activity pace. Estimating how often the reels will show a return animation. Comparing session “feel” between games where both hit rate and RTP are known. |
| Win Rate | How often a spin genuinely improves your balance — return exceeds total stake | How much those wins pay. The magnitude of losing spins. The aggregate expected cost of play. | Understanding the true frequency of balance-improving spins. Estimating LDW exposure on multi-line games. The most direct measure of “how often I profit” per spin. |
| RTP | The long-run average fraction of total wagered that is returned, across an infinite series | How often any return occurs. How often returns exceed stake. What any specific session will return. The distribution of outcomes around the mean. | Comparing expected cost between games (lower RTP = higher expected cost per unit wagered). Calculating expected session cost at a given stake and length. Choosing between certified RTP variants at different operators. |
The Number That Matters Most Depends on What You Are Deciding
Choosing between games: RTP is your primary input — a 97% RTP game costs less per unit wagered than a 94% game, regardless of volatility. Planning session feel: hit frequency tells you how often the game will respond with any return. Evaluating true profitability per spin: win rate is what you need, even though you almost never have direct access to it. Modelling what a session will actually cost and how outcomes will distribute: use RTP and volatility together — the volatility and RTP calculator combines both to produce a realistic outcome distribution for your specific stake and session length.
How Gambling Sites Consistently Get These Wrong
The confusion between hit frequency, win rate, and RTP is not accidental among gambling content sites — it is endemic and systematic. An academic audit of 247 iGaming websites found that mathematical terms were used without definition on the vast majority of reviewed sites, and that where definitions were provided, only 8.47% were mathematically correct. The three-way confusion between hit frequency, win rate, and RTP represents a specific category of this broader failure.
The most common errors in gambling content involving these three terms follow predictable patterns. RTP is described as “how often the game pays” — conflating an expected value with a frequency. Hit frequency is described as “your chance of winning on any spin” — conflating the frequency of any return with the frequency of profitable returns. Win rate is rarely mentioned at all — it is the most practically useful of the three for understanding profitability per spin, and the least frequently disclosed or discussed. Articles that claim to explain “how slots pay” without distinguishing these three measures are providing an incomplete and often misleading picture of the game’s true payout structure.
Red flag in gambling content. When a gambling site describes a slot as having “a high payout rate of 96%,” treating RTP as a “payout rate,” it is conflating an aggregate expected return with a per-spin payment frequency. 96% RTP does not mean 96% of spins pay anything. At a 32% hit frequency, 68% of spins return zero — regardless of the RTP figure. If a site’s game guide does not distinguish hit frequency from RTP, treat everything else it says about slot mathematics with the same scepticism.
Which Number to Use for Which Decision
Given that all three numbers exist and each answers a different question, the practical question is: which one do you reach for at each decision point before and during a session?
Before Choosing a Game: RTP First, Then Volatility
For game selection, RTP is the primary cost comparison tool. All else being equal, the game with higher RTP costs less per unit wagered across any session. Check whether your casino is running the highest available RTP variant of the game — operators configure variants and rarely disclose which one is active. Then check volatility to understand how that RTP is distributed — high volatility means the same RTP is concentrated in rare events, producing a different session texture than a low-volatility game at the same RTP. Casino strategies for slots covers how these two inputs combine for game selection.
Before Starting: Hit Frequency to Set Session Expectations
Where hit frequency is published — some studios include it in the game info panel, and review sites sometimes include it in game breakdowns — use it to calibrate your expectation for session activity. A 20% hit frequency means 80% of your spins will return zero. A 300-spin session will produce approximately 240 blank spins and 60 returns of any size. If you find long blank-spin sequences psychologically difficult to manage, a high-volatility game with 15% hit frequency will be harder than a lower-volatility game at 30%. Hit frequency tells you what the session texture will feel like — not what it will cost.
During a Session: Neither RTP nor Hit Frequency — Use Your Pre-Set Limits
During active play, none of the three numbers should be your primary reference point. RTP applies to an infinite series, not to your current session position. Hit frequency describes the aggregate frequency of any return, not whether the next spin will pay. Win rate describes the frequency of profit spins but cannot tell you when the next one will arrive. The most important reference point during a session is the pre-commitment structure you set before starting: your session loss limit, set via the responsible gambling planner at account level. That limit operates regardless of what the game’s statistical measures would suggest about your “position” — because those measures have no predictive value for any individual spin sequence.
After a Session: Use RTP to Evaluate Expected Cost, Not Actual Outcome
After a session, the appropriate use of RTP is to calculate what your session was statistically expected to cost — not to evaluate whether you “should have” won or lost. Stake × spins × (1 − RTP) = expected cost. If you ran 200 spins at £1 stake on a 96% RTP game, your expected cost was £8. If you lost £40, that is within the realistic variance range for a high-volatility game at those parameters. If you won £80, that is also within it. Your actual outcome should not be compared to the RTP as if RTP represents what you “deserved” — the session risk analyser models the realistic distribution of outcomes around the expected value for your specific parameters, which gives you a much more accurate frame for evaluating where your session landed.
Further Reading
The three-number framework in this article draws on the mathematical definitions from the gambling math guide, which covers all core slot mathematics terms in full. For the most detailed treatment of each metric individually: Slot Hit Rate covers hit frequency in full including how to read it for session planning; RTP Guide covers what RTP means precisely, what it does not mean, and how to use it for cost comparison; Volatility Guide covers how the shape of the win distribution relates to both hit frequency and the concentration of RTP in rare vs common events. For the LDW mechanism that creates the wedge between hit frequency and win rate on multi-line games, Losses Disguised as Wins covers the full structural explanation. For the hidden functional model that generates all three numbers, PAR Sheet Explained covers how reel strip configuration produces the statistical outputs that hit frequency, win rate, and RTP describe. For how all three numbers interact with the RNG to produce individual spin outcomes, the RNG article covers the mechanism. For tools that use RTP and volatility — the two most accessible of the three metrics — to produce a concrete session model, the Volatility and RTP Calculator and Session Risk Analyser translate the numbers into session outcome distributions.
Turn RTP Into a Real Session Model
RTP alone doesn’t tell you what will happen in your session. The Session Risk Analyser combines RTP and volatility to show you the realistic outcome distribution — expected cost, probable loss range, and probability of profit — before you spin.
Model My Session →Hit Frequency, Win Rate and RTP — FAQ
What is the difference between hit frequency and win rate in slots?
Hit frequency is the proportion of spins that return any positive amount, including sub-stake amounts. Win rate is the proportion of spins that return more than the total stake — genuinely profitable spins. On single-line games the difference is small. On multi-line games it can be significant: a spin where one payline pays £0.20 on a £2 total stake is counted in hit frequency but not in win rate, because the net result is a loss. The gap between the two is caused by Losses Disguised as Wins — a structural feature of multi-line slot design.
Does a high RTP mean a slot pays out frequently?
No. RTP is not a frequency measure — it is an aggregate expected return across an infinite series of spins. A high RTP game can have a very low hit frequency. A 97% RTP high-volatility slot might return something on only 18% of spins while concentrating the bulk of its return in rare large events. The remaining 82% of spins return zero. High RTP means the game costs less per unit wagered in long-run expectation — it says nothing about how frequently any given spin will produce a return.
Why is win rate almost never published for slot games?
Win rate requires knowing the exact probability of every spin outcome where the total payout exceeds the total stake — data that comes from the reel strip configuration in the PAR sheet. PAR sheets are proprietary and not publicly disclosed. Some studios publish hit frequency voluntarily; essentially none publish win rate directly. It can be estimated from extensive session data but requires tens of thousands of spins to achieve meaningful precision. The absence of win rate disclosure means players consistently overestimate how often they are genuinely profiting per spin, particularly on multi-line games where LDW spins inflate the apparent hit frequency.
What does a 35% hit frequency actually mean for a session?
It means approximately 35% of spins — roughly 1 in 3 — will produce a return of any amount. The other 65% will return zero. In a 300-spin session, you would expect approximately 105 “hit” spins and 195 blank spins. But those 105 hits include all returns — from tiny sub-stake payouts through to large wins. They are not all profitable. The win rate (which might be 15–20% on a 20-payline game with a 35% hit rate) tells you how many of those 105 hits actually improve your balance.
Can two slots have the same RTP but different hit frequencies?
Yes — and this is one of the most practically important things to understand about slot selection. RTP is the aggregate expected return. It is entirely compatible with very different hit frequency profiles. A 96% RTP can be achieved through frequent small returns (high hit frequency, low volatility) or through rare large returns (low hit frequency, high volatility). The RTP number itself does not tell you which design strategy the game uses. Volatility is the published indicator of how the RTP is distributed across the frequency spectrum — but even the volatility label is coarse. Two “High” volatility games at 96% RTP can have meaningfully different hit frequencies.
Is hit frequency the same as the “hit rate” advertised by some studios?
Yes — hit frequency and hit rate are the same metric described with different terminology. Some studios (notably NoLimit City) publish a “hit rate” figure in the game information. This is the proportion of spins producing any positive return — equivalent to hit frequency as defined here. The terminology is not standardised across the industry, which contributes to the general confusion between these metrics. When a game lists a “hit rate” without further specification, it almost certainly refers to hit frequency (any positive return) rather than win rate (return exceeding stake).
Which of the three numbers should I use to compare two slots?
It depends on what you are comparing. For expected cost per unit wagered: use RTP — the higher the RTP, the lower the expected cost, all else equal. For session activity pace and feel: use hit frequency where published — higher hit frequency means more frequent return animations and balance movement. For true profit frequency per spin: win rate, but this is almost never directly available. In practice, the most actionable comparison for most players is RTP (choose the higher one) combined with volatility (match to your bankroll — lower volatility for smaller budgets, higher for those who can sustain long dry runs). Hit frequency adds a useful third dimension where published.