Symbol weighting slots — the hidden mechanism that determines how often every symbol in the game can land — is the single most important concept that never appears in standard gambling content. Every probability attached to a slot game flows directly from it. The RTP, the hit rate, the volatility, the near-miss frequency, the true odds of any winning combination: all of these are downstream consequences of the symbol weighting encoded in the game’s reel strips. And yet symbol weighting in slots is completely invisible during play. The display shows you symbols. It does not show you how many times each symbol appears in the positions the RNG is sampling from. That gap — between what the display shows and what the math actually produces — is what symbol weighting creates.
What Symbol Weighting Actually Is
In a physical slot machine with three mechanical reels, each reel had a fixed number of physical stops — positions where the reel could come to rest. Each stop was printed with a symbol. A reel with 20 stops and 3 instances of the premium symbol had a weight of 3/20 — a 15% probability of landing that symbol per reel. Players could, in theory, count the symbols on the physical reel strip and calculate the odds. The math was right in front of them.
Virtual slots — which includes every online slot ever made — use a fundamentally different mechanism. The RNG generates a number that maps to a stop position on a virtual reel. The virtual reel is a data structure: a sequential list of positions, each assigned a symbol. That data structure is the reel strip. The number of times a symbol appears in the reel strip is its weighting — its weight. A virtual reel with 64 total positions and 2 premium symbol entries has a premium weight of 2/64 = 3.125%. A reel with 12 low-symbol entries has a low-symbol weight of 12/64 = 18.75%.
This is symbol weighting slots at its most precise definition: the number of stop positions assigned to each symbol on each virtual reel, expressed as a proportion of the total stops on that reel. It is the core data of the functional model. Every probability calculation in the game uses it as its primary input. Change the weighting and everything changes: RTP, volatility, hit rate, near-miss frequency, the average return on winning spins — all of it flows from how the designer allocated stops across symbols on each reel strip.
Symbol Weighting in Slots — Core Facts
The Reel Strip: How Symbol Weighting Is Encoded
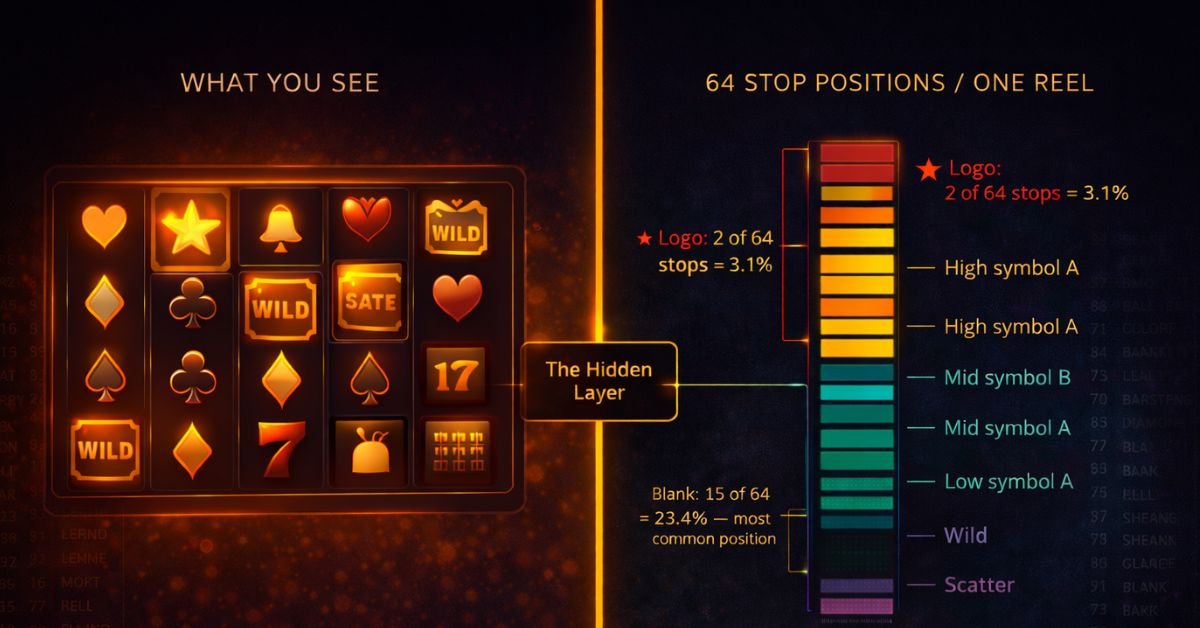
The vehicle for symbol weighting is the reel strip — the sequential list of all stop positions on a virtual reel, each one assigned a symbol. Visualise it as a vertical column of 64 cells (or however many stops the reel has), each cell labelled with a symbol name. The RNG generates a random number between 1 and 64, then reads the symbol at that position. That symbol is what the player sees in the reel window for that spin.
The symbol weighting for any symbol on any reel is simply: how many of those 64 cells contain that symbol. Two cells out of 64 = 3.125% weight. Twenty cells out of 64 = 31.25% weight. Because all cells are equally likely to be selected (the RNG samples uniformly across the range), weight directly equals probability. There is no additional randomness layer. The weighting is the probability.
This directness is what makes symbol weighting so powerful as a design tool. The math designer controls probability precisely by controlling the cell count for each symbol. They do not need to adjust formulas — they adjust stop counts. Increase a blank’s count from 15 to 20 cells: the blank lands more often, other symbols land less often, the hit rate drops. Decrease a premium symbol from 3 cells to 1 cell: its landing probability drops from 4.7% to 1.6%, making 5-of-a-kind combinations dramatically rarer without changing anything visible in the game interface.
A Worked Example: Reading a Weight Distribution
The table below shows an illustrative symbol weighting distribution for a single 64-stop reel in a 5-reel slot. This is not from any published PAR sheet — actual reel strip data is never disclosed. It is constructed to demonstrate how a typical weight distribution might look and what it implies.
Illustrative Symbol Weighting — Single Reel, 64 Stops
| Symbol Tier | Stops | Weight | Visual Weight | Prob. per Spin |
|---|---|---|---|---|
| ★ Premium (e.g. Logo) | 2 | 3.1% | ~1 in 32 spins | |
| ♦ High A | 3 | 4.7% | ~1 in 21 spins | |
| ♥ High B | 4 | 6.3% | ~1 in 16 spins | |
| ◆ Mid A | 6 | 9.4% | ~1 in 11 spins | |
| ● Mid B | 7 | 10.9% | ~1 in 9 spins | |
| ▲ Low A | 10 | 15.6% | ~1 in 6 spins | |
| ■ Low B | 12 | 18.8% | ~1 in 5 spins | |
| ☆ Wild | 3 | 4.7% | ~1 in 21 spins | |
| ◎ Scatter | 2 | 3.1% | ~1 in 32 spins | |
| — Blank | 15 | 23.4% | ~1 in 4 spins | |
| TOTAL | 64 | 100% |
Illustrative only — not from any published PAR sheet. Notice that blanks (23.4%) are the most common outcome on any given stop position. The premium symbol (3.1%) and scatter (3.1%) are each eight times rarer than blanks. This weight distribution would produce a low hit rate and significant volatility on a multi-reel game.
What This Distribution Immediately Tells You
Even without access to the full five-reel setup, this single reel’s weight distribution tells you a great deal. The premium symbol at 3.1% means it lands on this reel roughly once every 32 spins. For all five reels to land the premium simultaneously — the 5-of-a-kind combination — the probability is approximately 3.1%⁵ = (0.031)⁵ ≈ 1 in 33 million spins, before accounting for the fact that the other four reels likely have different (often lower) premium weightings than Reel 1. The blank at 23.4% is the single most common outcome on any stop position. Any spin has a nearly 1-in-4 chance of producing a blank on this reel alone — and blank alignment across multiple reels is what creates zero-return spins.
The distribution also reveals the design philosophy: this is a tiered system where each symbol tier has progressively higher weight as value decreases. Premium pays the most and lands the least. Low symbols pay the least and land the most. Blanks pay nothing and land most of all. This inverse relationship between value and frequency is what allows the game to maintain a target RTP while producing the apparent mix of outcomes players experience.
The Display vs the Math: Why What You See Isn’t What You Get
This is the central consequence of symbol weighting in slots: the symbols you see in the reel window during play look like they appear with roughly equal frequency — but they do not. The display presents nine or fifteen visible symbols across a 3×5 or 3×3 grid as if they are a representative sample of the game’s symbol set. They are not. What you see is a single random sample from a probability distribution heavily skewed toward blanks and low-value symbols and away from premium symbols. The visual presentation gives no information about the weighting behind it.
This gap has practical consequences for how players interpret their sessions. When a premium symbol lands on Reel 1, a player looking at the display sees it as a relatively ordinary event — one symbol out of several appearing on that reel. Mathematically, it is a 3.1% event, and its non-appearance is 96.9% likely on any given spin. The visual representation makes low-probability events look normal in frequency precisely because they do appear — just rarely enough that their true rarity is hidden in the session noise.
The Blank Is the Most Important Symbol You Never Think About
In the illustrative distribution above, the blank occupies 23.4% of the reel strip — the single largest share of any symbol. On a 5-reel game, the probability that all five reels simultaneously land a blank on a given spin is approximately 0.234⁵ ≈ 0.07% — but on multi-row games with payline logic, blanks on individual positions are what block combination completion, not five-reel alignment. The fundamental driver of zero-return spins is blank frequency on critical stop positions. A game with high blank density on middle and late reels produces many spins where premium symbols appear on early reels but the combination cannot complete because the critical middle positions are overwhelmingly likely to show blanks. This is the structural origin of both low hit rates and the near-miss effect — and it is written directly into the symbol weighting.
Reel Asymmetry: How Symbol Weighting Varies Across the Five Reels
One of the most important and least understood aspects of symbol weighting in slots is that it typically differs across the five reels. A fair coin has equal probability of heads on every flip. A slot’s premium symbol does not have equal probability on every reel — and this asymmetry is a deliberate design decision with specific consequences for session behaviour.
Why Reels Are Weighted Differently
The math designer has several reasons to weight symbols differently across reels. The most important is controlling the frequency of near-misses — situations where high-value symbols land on early reels but the combination fails to complete on later reels. By placing more premium symbol stops on Reel 1 and Reel 2 than on Reel 3 and Reel 5, the designer creates a situation where premium symbols appear frequently enough on early reels to generate the visual tease of a possible combination, but rarely enough on critical middle and late reels to prevent that combination from completing at high frequency.
Here is what asymmetric premium symbol weighting might look like across five reels in an illustrative high-volatility game:
Reel 1
Reel 2
Reel 3
Reel 4
Reel 5
The probability of this premium symbol landing on Reels 1 and 2 (both at 4.7%) but not completing on Reel 3 (1.6%) is far higher than the probability of it completing across all five reels. Early reels show the symbol often enough to create anticipation. Late reels are suppressed enough to prevent that anticipation from resolving into a win at high frequency. The 5-of-a-kind probability is: 3/64 × 3/64 × 1/64 × 2/64 × 1/64 ≈ 1 in 23 million spins.
Near-misses are asymmetric weighting in action. When two premium symbols land on the first two reels and the third reel shows a blank, you are not witnessing a close call with a random outcome. You are seeing the direct consequence of a reel strip where Reels 1 and 2 have higher premium symbol weighting than Reel 3. The near-miss is more frequent than a uniform distribution would produce because the weighting is designed to be asymmetric. The feeling of “so close” is responding to a structural design decision, not to a probabilistic near-event. The next spin’s probability is identical to every previous spin’s — the asymmetric weighting produces exactly the same probability every time.
How Different Weighting Strategies Produce Different Games
The way the math designer allocates symbol weighting in slots across the reel strip is the primary tool for shaping a game’s character — its volatility, its hit rate, its session feel, and its maximum win potential. Two games with identical RTP and identical paytables can have radically different player experiences because their weighting strategies differ.
| Weighting Strategy | Premium Stops (per reel) | Blank Stops (per reel) | Result | Player Experience |
|---|---|---|---|---|
| High premium weight, low blank weight | 5–8 per reel | 5–10 per reel | High hit rate, low volatility | Frequent small wins, rare large wins, fast balance movement, few zero-return streaks |
| Low premium weight, high blank weight | 1–2 per reel | 15–25 per reel | Low hit rate, high volatility | Long zero-return streaks, rare but large wins, slow balance movement punctuated by peaks |
| Asymmetric: high early / low late | 3–4 on R1–R2, 1 on R3–R5 | Moderate throughout | High near-miss frequency | Premium symbols appear on early reels often, combinations rarely complete — near-misses frequent |
| Flat uniform weighting | 2–3 per reel, consistent | 10–15 per reel, consistent | Near-miss rate reflects pure probability | Session feel more “random” — early-reel teasing less pronounced |
| Very sparse premium, large blank mass | 1 per reel on 3 of 5 reels | 20–30 per reel | Extremely high volatility, very high max win | Most sessions produce very little; rare sessions produce very large outcomes; bonus feature carries bulk of RTP |
This table shows that game feel is not primarily determined by the art, the theme, or even the features — it is determined by symbol weighting. A game with a desert-temple theme and a game with a space-explorer theme that share identical weighting strategies will feel almost identical to play, despite their completely different visual presentations. This is why players who develop preferences for “how a game plays” are, without knowing it, developing preferences for weighting strategies. The theme is the surface. The weighting is the substance.
What Symbol Weighting Implies About the Session You’re About to Have
Since the actual symbol weighting is hidden in the PAR sheet, players cannot access it directly. But the published statistical outputs of the game — RTP, volatility, hit rate where available, and maximum win — allow you to infer the broad characteristics of the weighting strategy, even without seeing the reel strip data. This is the core of the decoding approach described in the slot mathematical model decoding framework.
High Volatility — What It Implies About Weighting
High volatility necessarily implies sparse premium symbol weighting and high blank density across the reel set. The statistical model cannot produce high variance without the functional model concentrating the majority of stops on low-value and blank positions. A “High” volatility label tells you that the premium symbols occupy very few stops per reel — likely 1–3 — and that blanks dominate the reel strip. Long zero-return streaks between wins are a mathematical certainty of this weighting structure, not a run of bad luck.
Low Volatility — What It Implies About Weighting
Low volatility implies more moderate weighting across all symbol tiers — premium symbols at 5–8% per reel, mid-symbols at 10–15%, blanks at a lower proportion of the total. The weighting distribution is more balanced, producing more frequent combination completions and a higher hit rate. A “Low” volatility label tells you the functional model’s reel strips are configured to produce frequent activity at the cost of rare very large events.
Very High Max Win — What It Implies About Weighting
A max win of 25,000× or higher necessarily implies extreme premium symbol sparsity. For a 25,000× combination to be mathematically achievable but rare enough to be economically feasible within the RTP budget, the premium symbol must occupy very few reel positions — likely just 1 stop per reel on most or all reels. The paytable ceiling is achievable, but the probability of reaching it is 1 in tens of millions of spins.
Hit Rate (Where Published) — Direct Weighting Inference
Hit rate is the most direct available inference about the functional model’s weighting density. A 20% hit rate means 80% of stops across all reels produce zero-return outcomes — blanks and non-winning combinations dominate. A 35% hit rate means the weighting is more uniformly distributed, with more symbol combinations landing on each position. Where studios publish hit rate alongside RTP and volatility, this trio of numbers is the most complete available picture of the weighting strategy without the PAR sheet.
Practical pre-session inference: Before playing a slot, look up its RTP, volatility label, hit rate (if published), and max win. From these four numbers, you can infer: approximately how sparse the premium symbol weighting is, how high the blank density is across the reel set, how long zero-return streaks are likely to last, and what the realistic outcome range of a session at your stake will be. You cannot see the reel strip — but you can build an accurate enough picture of the weighting strategy to make an informed decision about whether this game’s profile fits your bankroll and session tolerance.
How Symbol Weighting Produces Cognitive Distortions
Symbol weighting in slots is not only a mathematical mechanism — it is also the structural source of several cognitive distortions that affect how players interpret their sessions. Understanding the weighting eliminates the factual basis for each distortion.
The Gambler’s Fallacy and Weighting
The gambler’s fallacy — the belief that a losing run makes a win more likely — implicitly assumes the probability of winning is somehow adjustable by session history. In a weighted reel strip system, the probability of any symbol landing on any spin is fixed by the stop count. A premium symbol occupying 2 of 64 stops has a 3.125% probability on every spin regardless of what the previous 50 spins produced. The weighting does not self-correct. The blank occupying 15 of 64 stops will continue to appear at 23.4% frequency whether or not you feel “overdue” for a premium symbol. The fallacy treats a fixed, weighted system as if it were a compensating one.
Hot and Cold Beliefs and Weighting
The hot and cold slots belief — that machines enter winning and losing phases — requires the symbol weighting to change over time. It does not. The reel strip configuration is fixed at certification by the testing laboratory. The weights encoded in the PAR sheet apply identically on spin 1 and spin 10,000,000. A “cold” machine is not a machine with suppressed weighting — it is a machine whose fixed weighting has produced a sequence of low-probability outcomes in the observable window. That sequence carries no information about the next spin’s probability.
Illusion of Control and Weighting
The illusion of control — the belief that stopping the reels at the right moment, or betting at the right time, influences outcomes — assumes player actions affect the sampling of the reel strip. They do not. The RNG samples a stop position from the reel strip independently of any player interaction. The timing of the spin button press selects a different number from the RNG sequence, but that number was generated by a deterministic algorithm producing uniformly distributed outputs — there is no “right moment” in a uniform distribution. The weighting applies equally to every sampled position.
Losses Disguised as Wins and Weighting
The losses disguised as wins phenomenon is a direct consequence of low-tier symbol weighting on multi-line games. Low-tier symbols have high weighting — 15–20% per reel — which means low-value combinations appear frequently. On a 20-payline game at £0.05 per line (£1 total stake), a 3× Low Symbol B win paying 5× the line bet returns £0.25 — a net loss of £0.75. But the game celebrates this with sounds and visuals. The high weighting of low symbols produces frequent sub-stake returns that the display frames as wins. Understanding the weighting reveals that these are losses with a celebration layered on top, not wins.
Further Reading
Symbol weighting is the core mechanism of the functional model. The slot mathematical model decoding framework places symbol weighting within the full two-model taxonomy and explains how public statistical outputs can be used to infer the weighting strategy without access to the PAR sheet. The PAR sheet article covers the full document that specifies symbol weighting — including the specific mathematical notation for reel strip configuration and the worked formulas that translate weighting into probability. For how the RNG translates weighting into actual spin outcomes, How RNG Works in Online Slots covers the mapping from generated number to reel stop position. For the statistical model outputs that give the most useful inferences about hidden weighting, RTP Guide, Volatility Guide, and Slot Hit Rate provide the full treatment. For the near-miss consequence of asymmetric weighting, Near-Miss Effect in Slots covers the psychological mechanism and its connection to reel strip design. For how weighting-driven structural features connect to the full landscape of cognitive distortions, Player Psychology in Slot Games is the hub. To model what a specific weighting strategy produces in session terms at your stake, the Volatility and RTP Calculator and Session Risk Analyser translate game parameters into concrete session profiles.
See What the Symbol Weighting Means for Your Session
The Session Risk Analyser uses the game’s published RTP and volatility — the statistical model outputs that reflect the hidden symbol weighting — to model your realistic session outcome distribution at your stake.
Model My Session →Symbol Weighting in Slots — FAQ
What is symbol weighting in a slot machine?
Symbol weighting is the number of stop positions each symbol occupies on a virtual reel, expressed as a proportion of the total stops. A reel with 64 stops where the premium symbol occupies 2 positions has a weight of 2/64 = 3.125% — meaning the RNG has a 3.125% probability of selecting that symbol on that reel on any given spin. Because the RNG samples uniformly across all positions, weight directly equals probability. Symbol weighting is encoded in the reel strip — the sequential list of all stops and their assigned symbols — which is the core data of the PAR sheet’s functional model.
Is symbol weighting visible during play?
No. The display shows symbols landing on the reels but gives no information about how often those symbols appear in the reel strip’s position list. A premium symbol that lands occasionally during play appears to occur at roughly the same frequency as other symbols from the display’s perspective — but the actual weighting may make it 8–10 times rarer than a blank on any given stop position. The gap between the visual presentation and the mathematical weighting is what makes slots uniquely opaque among casino games.
Why do different reels have different symbol weightings?
Reel weighting asymmetry is a deliberate design tool. By placing premium symbols at higher weight on early reels (1 and 2) than late reels (3, 4, and 5), the math designer creates a situation where premium symbols appear on early reels often enough to create visual anticipation, but rarely enough on critical middle and late reels to prevent combinations from completing at high frequency. This asymmetry produces near-misses at rates higher than a uniform distribution would generate — it is a structural design decision, not a random occurrence.
How does symbol weighting create near-misses?
When premium symbol weighting is higher on early reels than late reels, the probability of the premium symbol landing on Reels 1 and 2 (at 4.7% each) is dramatically higher than the probability of it landing on all five reels simultaneously. This means two-reel landings — which the display presents as a near-miss — occur far more frequently than five-reel completions. The near-miss is not a random proximity signal. It is the visible consequence of deliberately asymmetric weighting across the reel set, specified in the PAR sheet before the game was built.
What does high volatility imply about symbol weighting?
High volatility necessarily implies sparse premium symbol weighting and high blank density. The statistical model cannot produce high variance without the functional model concentrating most stop positions on low-value symbols and blanks, with premium symbols occupying very few positions. A high-volatility label tells you the reel strips have premium symbols at 1–3% weight per reel and blanks at 20–35%+ weight — producing long zero-return streaks between rare large wins. This is not a description of the game’s behaviour — it is a description of its structure.
Can players access symbol weighting data for online slots?
No. Symbol weighting is contained in the PAR sheet — Probability Accounting Report — which is the proprietary specification document submitted to regulatory testing laboratories under confidentiality. It is never disclosed publicly for any online slot from any major international studio. Some Canadian provincial lottery corporations have historically published PAR sheets for land-based machines, providing researchers with real weighting data. Online slot PAR sheets from international studios operating under MGA, UKGC, or similar licences are not publicly accessible through any channel. The published RTP, volatility, hit rate (where available), and max win are the only public proxies for what the hidden weighting actually looks like.
How does symbol weighting relate to the RTP I see published?
The published RTP is entirely derived from symbol weighting. RTP is calculated as the sum of all (combination probability × combination payout) products across the full game. Each combination probability is itself derived from the symbol weights on the relevant reels. Change any weight and the RTP calculation changes. The certified RTP is a constraint on the functional model: whatever the reel strips look like, their weighting must combine with the paytable to produce exactly the stated RTP within the approved tolerance. RTP is the aggregate statistical output of the symbol weighting system.