Two slots. Both certified at 96% RTP. Both licensed, both audited, both fair. You play the first one for an hour — steady action, regular small returns, balance moving up and down in predictable rhythm. You play the second for an hour — long stretches of nothing, then a sudden 400× spike that almost recovers everything. Same number. Completely different experience. Same RTP different feel is not an illusion, a psychological quirk, or a matter of personal perception. It is the mathematical consequence of something RTP cannot tell you: how the identical return percentage is distributed across the probability architecture of each game. This article explains the exact mechanisms that create it.
What the RTP Number Hides
Return to Player is a single number expressing the probability-weighted average return across every possible spin outcome in the game. At 96%, for every £1 wagered across an effectively infinite series of spins, 96p is returned in payouts. That calculation sums every combination in the game — every low-value payline win, every bonus trigger, every maximum win event — weighted by how often each occurs, and produces a single percentage.
What that single percentage cannot tell you is how those outcomes are arranged. The same 96% can be generated by a game where small wins occur on 35% of spins and no single outcome pays more than 200×. It can equally be generated by a game where 88% of spins return zero and the 12% that do pay are concentrated in a tail reaching 25,000×. Both games have a 96% RTP. Their probability architectures are entirely different. Their session experiences are entirely different. Their reel strip configurations — the virtual reel stop assignments encoded in the PAR sheet — are entirely different.
The same RTP different feel problem is not a mystery. It is the predictable consequence of treating a single aggregate statistic as a complete description of a probability distribution. RTP describes the mean of a distribution. It says nothing about the shape of that distribution — whether it is narrow and concentrated (frequent small returns) or wide and heavy-tailed (rare large returns). That shape is what you experience during play. It is what determines whether the game feels like a steady cost or an unpredictable surge.
Same RTP Different Feel — Core Facts
The Three Drivers of Same RTP Different Feel
Three mathematical properties — each independent of the RTP figure — determine whether a game feels like a steady grind or an unpredictable variance ride. All three are properties of the game’s functional model: the virtual reel strip configuration and paytable structure held in the PAR sheet. All three can differ radically between two games with identical RTPs.
Understanding all three is what separates a player making an informed game selection from a player choosing purely on RTP and visual theme. The RTP tells you the long-run average cost per unit wagered. The three drivers below tell you what the game will actually feel like during the session where you are spending that money.
Driver 1 — Volatility: How the RTP Budget Is Distributed
Volatility is the statistical measure of how concentrated or dispersed the win distribution is. In direct terms: how evenly is the 96% RTP budget spread across the range of possible outcomes? A low-volatility game spreads it broadly — many outcomes, each contributing a small slice. A high-volatility game concentrates it — fewer outcomes, each contributing a larger slice, the largest being very rare and very large.
The source of this difference is the virtual reel strip. In a low-volatility game, the reel strips assign more stops to mid- and low-value symbols, fewer stops to blanks, and more moderate paytable values to the premium tier. Many combinations can complete; few of them pay enormous amounts. In a high-volatility game, the reel strips assign very few stops to premium symbols, very many to blanks, and very high paytable values to the premium tier. Few combinations complete; the ones that do can pay spectacularly. Same RTP. Entirely different reel strip architecture.
For a player sitting down with a £100 session budget, these two distributions are not equivalent experiences. Game A returns small amounts regularly, keeping the balance relatively stable as it gradually declines toward the expected cost. Game B returns nothing for long stretches — potentially burning through significant portions of the £100 in blank spins — before a rare large event that may or may not arrive within the session. Both have an expected cost of £4 per £100 wagered. The path to that cost is entirely different.
Driver 2 — Hit Rate: How Often the Game Responds
The hit rate is the proportion of spins that return any positive amount — including sub-stake returns. It is the frequency with which the game produces any response at all. On a 20-payline game, a hit includes spins where one payline pays £0.10 on a £2 total stake — a loss disguised as a win, but still counted in the hit rate. Even so, hit rate is the most direct available measure of session activity frequency.
Hit rate and volatility are related but not equivalent. Two games can have the same volatility label and different hit rates if their paytable structures weight their returns differently. But as a general pattern: low-volatility games have higher hit rates (25–40%), and high-volatility games have lower hit rates (12–22%). The same RTP different feel problem shows up acutely at the hit rate level: a player moving from a 35% hit rate game to a 15% hit rate game at the same RTP will experience the second game as dramatically “tighter” — producing far more blank spins, far less regular feedback — even though the long-run cost is identical.
Why Hit Rate Is the Most Underappreciated Same RTP Driver
Most players comparing two slots check RTP. Some check volatility. Almost none can access hit rate — it is rarely disclosed and not required by most regulators. Yet hit rate is the most direct driver of session texture: how often the game provides any feedback, how long the blank-spin sequences last, how frequently the balance moves at all. Two games at 96% RTP with a 30% vs 15% hit rate feel like entirely different categories of game during actual play, even if their maximum wins and volatility labels are similar. The absence of hit rate from standard disclosures is one of the clearest examples of how the information asymmetry between the game’s math model and the player-facing information stack shapes the gambling experience without player awareness.
Driver 3 — Base Game vs Bonus Split: Where the RTP Lives
Modern slots — particularly high-volatility games — allocate a significant portion of their total RTP to bonus features rather than to base game outcomes. A game might have a 40/60 split: 40% of its 96% RTP is delivered through base game wins, and 60% is delivered through bonus rounds. Another game at the same 96% RTP might have a 70/30 split: most of its return comes from base game spins with only a minority reserved for features.
This split has a profound effect on the same RTP different feel problem. In a 40/60 game, a player who does not trigger the bonus in a typical session will observe a return substantially below 96% — because most of the RTP budget has not been accessible to them. The certified 96% assumes bonus participation. Without it, the effective base-game RTP they experienced was closer to 38% (40% of the 96% total). Only with the bonus triggered does the full RTP become accessible.
In a 70/30 game, the base game delivers the majority of RTP on every spin regardless of bonus frequency. The player who never triggers the bonus still experiences roughly 67% effective RTP in the base game (70% of 96%). Their session is not dependent on a rare trigger event to realise most of the game’s certified return.
The Session Implication of a Bonus-Heavy RTP Split
When a high-volatility game allocates 60–70% of its RTP to a bonus feature, the certified RTP percentage is a statistical fiction for any session where the bonus does not trigger. A 200-spin session on a game with a 1-in-180 average bonus frequency has approximately a 33% chance of triggering the bonus zero times. In that scenario, the player has experienced a game whose effective RTP during their session was considerably lower than the published figure — not because the game is unfair, but because the bonus-heavy RTP split means the certified return is only accessible when the game’s rarest trigger event occurs. This is not disclosed to players in any standard format.
Worked Example: Two Games, One RTP, Completely Different Math Models
The following presents two hypothetical games designed to illustrate the same RTP different feel problem in concrete, comparable numbers. Both are certified at 96% RTP. Everything else about their math models differs.
What a 300-Spin Session Looks Like on Each
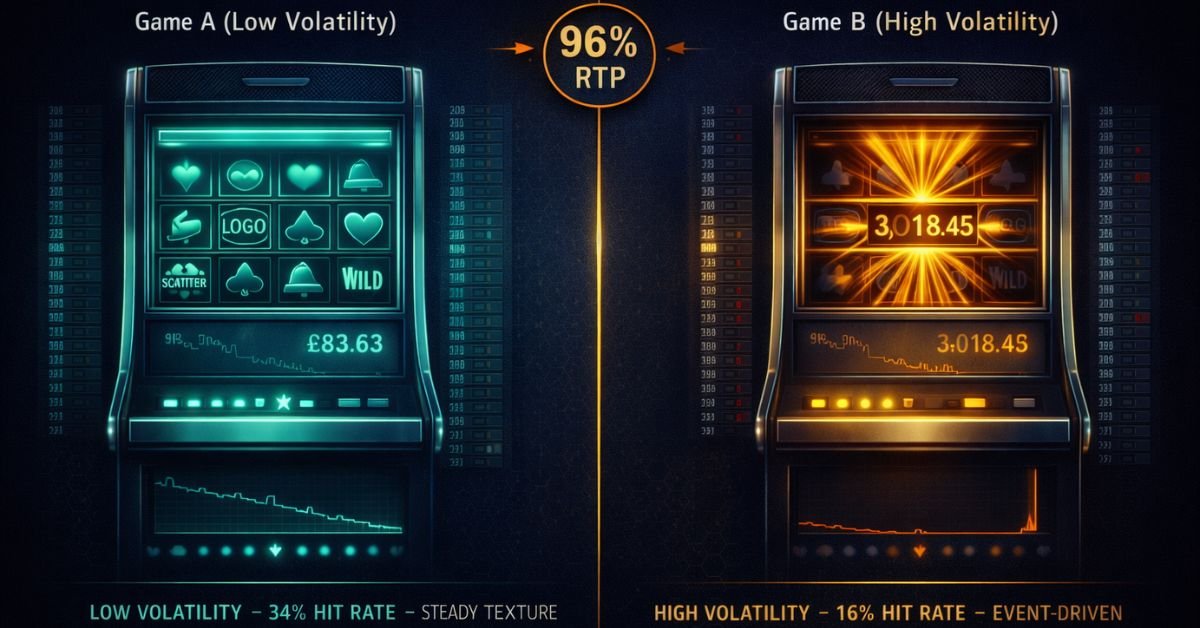
Game A — 300 Spins at £1
Approximately 102 hits (34% × 300). Zero-run average: 2–4 spins before any return. Balance declines gradually but moves regularly — rarely more than 6 blank spins in a row. Bonus triggers approximately 3 times (300 ÷ 90). Expected cost: £12. Realistic range: −£5 to −£35 in 80% of sessions. The session feels active, engaged, and legible — each spin provides feedback relatively quickly.
Game B — 300 Spins at £1
Approximately 48 hits (16% × 300). Zero-run average: 5–12 spins before any return. Balance can drop £15–£30 before the first meaningful win. Bonus triggers approximately 1–2 times — and may not trigger at all (33% chance of zero bonus triggers). Expected cost: £12. Realistic range: −£0 to −£140 in 80% of sessions. The session feels gruelling until it suddenly doesn’t — one bonus can recover a significant portion of the session loss, or not arrive at all.
Both sessions have the same expected cost of £12. The distribution of outcomes around that expectation is dramatically different. Game A’s realistic 80% range spans £30. Game B’s spans £140. A player with a £50 session budget faces a meaningful probability of bust before the session ends on Game B. On Game A, that probability is much lower. The RTP told them nothing about this difference. The volatility label, hit rate, and RTP split together would have told them almost everything.
The Cognitive Layer: Why the Feel Difference Affects How You Play
The same RTP different feel problem is not only a mathematical observation. It has direct cognitive consequences. The way a game’s probability distribution shapes your session experience actively engages the cognitive mechanisms that drive harmful gambling patterns.
High-Volatility Dry Runs and Chasing
Long zero-return sequences — the hallmark of high-volatility, low-hit-rate games — trigger the psychological conditions for gambler’s fallacy thinking and loss chasing. After 15 consecutive blank spins, the fallacy generates urgency: a win must be coming. The math model is indifferent. The next spin’s probability is identical to every previous one. But the session experience — the progressive balance decline, the accumulation of blanks — creates the subjective impression of a system that is about to correct itself. High-volatility games with their concentration of RTP in rare events are particularly prone to creating this dynamic.
Low-Volatility Frequent Hits and LDW
Low-volatility, high-hit-rate games have their own cognitive trap. The high frequency of returns includes a significant proportion of losses disguised as wins — spins where one or more paylines pay but the total return is below the total stake. These trigger win animations and credit additions while the balance decreases. The player experiences a rapid rhythm of apparent wins that gradually drains their balance without the dramatic loss events that might otherwise signal a problem. The psychology of slot design research consistently identifies LDW exposure as one of the most insidious structural features of multi-line game design.
The Near-Miss Pattern
Both game types generate near-misses, but through different mechanisms. High-volatility games engineer near-misses through aggressive reel asymmetry — premium symbols on early reels appear frequently despite being rare on late reels, creating frequent two-reel premium landings that fail to complete. Low-volatility games generate near-misses more uniformly from their more balanced reel strips, but at a lower absolute frequency. In both cases, the illusion of control and the feeling of proximity to a large win motivate continued play beyond the player’s rational assessment of their session.
How to Use This Before Choosing a Game
The same RTP different feel problem has a practical solution: use all available information about a game’s distribution, not just its mean. The following is the informed game selection checklist.
| Information | Where to Find It | What It Tells You | Decision Use |
|---|---|---|---|
| RTP | Game info panel, casino lobby | Long-run average cost per unit wagered. Not your session return. | Compare cost between games. Choose higher where available. Verify which variant your casino runs. |
| Volatility label | Game info panel, review sites | Coarse indicator of how concentrated wins are. High = rare large events, Low = frequent small returns. | Match to bankroll. High volatility requires a larger bankroll relative to stake to survive dry runs. |
| Hit rate | Some studio info panels (e.g. NoLimit City), review sites where published | How often any return occurs. Most direct measure of session activity pace. | Low hit rate (under 20%) = long blank sequences. Choose based on psychological tolerance for blank-spin stretches. |
| Max win | Game info panel, paytable | Upper bound of what the game can pay. Very high max win (10,000×+) implies very sparse premium weighting and extreme variance. | High max win games are more volatile than the label may suggest. Model whether the max win is realistic within any session you will ever have. |
| Bonus frequency | Some review sites, studio data sheets | How often the bonus triggers. Combined with RTP split, tells you how dependent the game’s return is on bonus participation. | High bonus frequency + high bonus RTP = your session return depends heavily on whether the bonus arrives. Low bonus frequency games are higher variance than the volatility label implies. |
| RTP split (base/bonus) | Rarely disclosed. Some studio transparency reports. | How much of the certified RTP is delivered in base game vs bonus rounds. | High bonus RTP allocation means the certified figure is inaccessible in sessions where the bonus does not trigger. Price this into your expectation. |
No single number — not even the full combination above — allows you to see the game’s virtual reel strip configuration. That remains in the PAR sheet. But the combination of RTP + volatility + hit rate + max win + bonus frequency gives you enough information to place the game in the right category: low-variance steady grind, medium-variance balanced, or high-variance event-driven. Those categories produce genuinely different session experiences that the RTP number alone completely obscures.
Before choosing any game: check the four publicly available numbers — RTP, volatility, hit rate (where published), and max win — and run them through the volatility and RTP calculator to see the realistic session outcome distribution at your intended stake and session length. The same RTP different feel problem becomes visible the moment you model the distribution rather than just reading the mean. The session risk analyser makes that modelling concrete before you place your first spin.
Further Reading
The same RTP different feel problem sits at the intersection of the math model cluster and the slot mechanics cluster. For the foundational understanding of why RTP is a mean rather than a distribution description, the RTP Guide covers the correct interpretation and its limits. For the volatility concept that is the primary driver of the feel difference, the Volatility Guide covers how the win distribution shape relates to session experience. The Hit Rate article covers the second driver — frequency of any return — in full. For the virtual reel mechanism that produces different volatility and hit rate profiles from the same RTP starting point, the Virtual Reels Explained article covers the functional model layer where all three drivers originate. ⚠ Verify live before publishing. For the losses disguised as wins consequence of high-hit-rate games, Losses Disguised as Wins covers the full mechanism. For how the same RTP different feel problem interacts with cognitive distortions — specifically why high-volatility games trigger chasing behaviour and why high-hit-rate games enable LDW desensitisation — Player Psychology in Slot Games and the Gambler’s Fallacy article are the relevant connections. For game selection tools that translate the four public numbers into a concrete session model, the Volatility and RTP Calculator and Session Risk Analyser apply them at your specific stake and session length.
See How Two Games With the Same RTP Feel Different
The Session Risk Analyser models your realistic outcome distribution — not just the average — at your stake and session length. Run it on two games at the same RTP and see the difference in their realistic ranges.
Model My Session →Same RTP Different Feel — FAQ
Why do two slots with the same RTP feel so different to play?
Because RTP is the mean of the win distribution, not its shape. Two games with identical 96% RTPs can have completely different win distributions — one spreading its returns across frequent small events, the other concentrating them in rare large events. The distribution shape is determined by volatility, hit rate, and the base game vs bonus RTP split — three properties of the game’s functional model that RTP alone cannot reveal. What you experience during play is the shape of the distribution, not its mean.
What is the main driver of the same RTP different feel problem?
Volatility is the primary driver — the statistical variance of the win distribution. High-volatility games concentrate most of their RTP in rare large events, producing long sequences of zero returns punctuated by infrequent large wins. Low-volatility games spread their RTP across frequent small events. Hit rate is the secondary driver: how often any return occurs at all, regardless of size. The base game vs bonus RTP split is the third driver: whether the certified return is accessible through regular base game spins or depends heavily on a rare bonus trigger.
Can two 96% RTP games have completely different reel strip configurations?
Yes — and this is the mathematical foundation of the same RTP different feel problem. RTP is a single aggregate statistic: the probability-weighted sum of all possible outcomes divided by the stake. Many different reel strip configurations can produce the same aggregate. A configuration with dense low-value symbol coverage and sparse premium positions produces a different distribution than one with very sparse overall coverage and a few extreme premium events — yet both can calculate to 96% RTP. The reel strip configuration is the hidden layer that the RTP number does not expose.
What does the base game vs bonus RTP split mean for players?
It means that in games with a high bonus RTP allocation — where 50–70% of the certified return is delivered through bonus rounds — the actual return experienced in sessions where the bonus does not trigger will be substantially below the published RTP. A 96% RTP game with a 40/60 base/bonus split delivers approximately 38% effective RTP through base game spins alone. The other 58% is only accessible when the bonus triggers. Players who have a session without a bonus trigger are effectively playing a much lower RTP game than the headline figure suggests.
Is a high-volatility slot a better or worse choice than a low-volatility slot at the same RTP?
Neither is objectively better — they are different products with different risk profiles. The correct choice depends on your session bankroll relative to your stake and your psychological tolerance for blank-spin sequences. High-volatility games require a larger bankroll relative to stake to survive their dry runs and give the distribution time to play out. Low-volatility games deliver more regular feedback but include more losses disguised as wins, particularly on multi-line games. The key decision is matching the volatility profile to your bankroll — not treating the same RTP as an indication of equivalent value.
Why is hit rate not published for most slot games?
Hit rate requires calculating the sum of all non-zero-return combination probabilities — data that comes from the reel strip configuration in the PAR sheet, which is proprietary. Some studios publish it voluntarily as part of their transparency approach, but most do not and there is no regulatory requirement to do so in most jurisdictions. The absence of hit rate from standard disclosures means players cannot directly compare session activity pace between games — one of the most practically meaningful dimensions of the same RTP different feel problem.
How do I compare two same-RTP games before choosing which to play?
Use all available information in combination: RTP (confirm which variant your casino runs), volatility label, hit rate where published, max win, and bonus frequency where available. Run them through a session modelling tool to see the realistic outcome distribution at your intended stake and session length. The same RTP different feel problem becomes concrete when you model the distribution rather than just comparing the mean: two games at 96% RTP may show an 80% probability range of £5–£35 versus £0–£140 at the same stake. That comparison tells you what you actually need to know before you start.